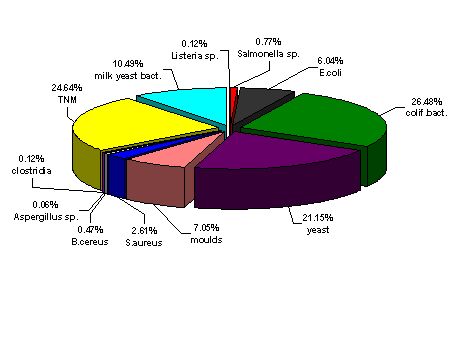
3. Inspection 3.3 Results of Control of Microbiological Requirements The microbial contamination of food can be risky or cause harm to human health. A duly performed inspection, monitoring and the Rapid Alert System operated for the sake of the prevention from alimentary infections and intoxications lay the basis of public health protection. CAFIA, as a body of state surveillance over food, carried out inspections focusing on the compliance with the microbiological requirements for food laid down in a decree issued by the Ministry of Health No. 294/1997, Coll. of L., as amended. The control of microbiological requirements was intent on the individual kinds of foodstuffs by the individual seasons of the year. As for the epidemiologically dangerous foodstuffs (such as cold meals and confectioneries) their sampling was carried out all the year through, with special emphasis laid on summer months. Majority of the microbiological analyses were carried out in laboratories, but some assessments were done directly in the places of inspection (in shops, warehouses, etc.), such as the verification whether foodstuffs show any adverse changes caused by microbial actions or an undesirable growth of microorganisms (moulds visible by naked eye, wet rot). In 2002 the controls performed in the place of inspection and in laboratories detected the total of 3,092 microbiologically nonconforming food samples (of which 1,299 were detected in places of inspection and 1,793 were detected in laboratories). The highest numbers of nonconforming samples were detected in commodities such as fresh vegetables (797), confectioneries (669), cold meals (580), fresh fruit (383) and meat – meat products (153). Results of laboratory analyses The microbiological laboratory analyses of food were performed in compliance with standards and methodological guidance notes valid in the Czech Republic. Of the total number of 7,995 food samples taken and brought to laboratories for microbiological analyses, altogether 1,793 samples (22.4 %) were identified as nonconforming in 2002. Of which 111 samples were detected as risky to human health, the other samples did not comply with the tolerated values only. The highest numbers of nonconforming samples were usually detected in summer months. The most frequently presented cause of the non-compliance with the microbiological requirements was the determination of coliform bacteria and anaerobic mesophilic microorganisms (TNM – total number of microorganisms). Monitoring In addition to ordinary controls, also planned microbiological controls (monitoring) were included in the assessment of the level of microbiological purity. Every year specific groups of food are selected to be included in monitoring, which are known to have plaid a significant role as for the emergence of alimentary diseases. In order to prevent from infections and intoxications induced by foodstuffs, the monitoring includes also detection of bacterial agent of alimentary diseases, sporadically occurring in foodstuffs. The presences of staphylococcal bacterial toxins were monitored in 2002. The scale of planned microbiological control carried out in 2002 was almost twice as large as in previous years. Within the scope of the microbiological control planned for 2002 the total of 870 samples were analysed, of which 265 (30.5 %) were assessed as nonconforming and 24 as risky to public health. Table 3.3.1: Results of control of the microbiological requirements in foodstuffs. Number of nonconforming samples by the individual commodities
Commodity | Number of nonconforming samples assessed | Total |
| | in place of inspection | in laboratory | |
| Dairy products | 51 | 30 | 81 |
| Poultry, eggs | 5 | 13 | 18 |
| Meat, meat products | 41 | 112 | 153 |
| Fish and aquatic animals | 1 | 23 | 24 |
| Processed fruit and vegetables | 9 | 15 | 24 |
| Spirit, liquors, yeast | 0 | 10 | 10 |
| Non-alcoholic beverages | 0 | 50 | 50 |
| Mill grain products | 3 | 14 | 17 |
| Grape Wine | 0 | 100 | 100 |
| Refrigerated products | 0 | 13 | 13 |
Baked products | 29 | 28 | 57 |
| Cold meals | 1 | 579 | 580 |
| Confectionaries | 0 | 669 | 669 |
| Pasta | 0 | 27 | 27 |
| Dehydrated products flavoured | 0 | 14 | 14 |
| Ice and ice creams | 0 | 16 | 16 |
| Pasta | 0 | 27 | 27 |
| Packed products | 0 | 26 | 26 |
| Fresh fruit | 372 | 11 | 383 |
| Fresh vegetables | 787 | 10 | 797 |
| Potato products | 0 | 5 | 5 |
| Dry shell fruits | 0 | 28 | 28 |
| Total | 1, 299 | 1, 793 | 3, 092 |
Graph 3.3.1 - Results of control of the microbiological requirements in foodstuffs. Number of nonconforming samples by the individual commodities 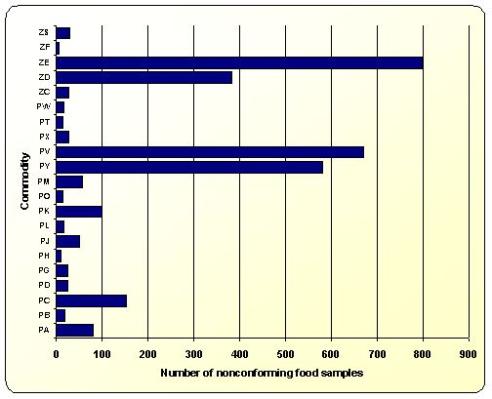
Explanation of abbreviations: |
| PA – dairy products | PY – cold products |
| PB – poultry, eggs | PV – confectioneries |
| PC – meat, meat products | PX – pasta |
PD – fish and aquatic animals | PT – dehydrated products flavoured |
| PG – processed fruit and vegetables | PW – ice and ice creams |
| PH – spirit, liquors, yeast | ZC – paced products |
PJ – non-alcoholic beverages | ZD – fresh fruit |
| PL – mill grain products | |
| PK – grape wine | ZF – potato products |
| PO – refrigerated products | ZS – dry shell fruits PM – baked products |
| PM – baked products | |
Table 3.3.2 : Number of samples analysed in the CAFIA microbiological laboratories in 2002
2002 | Total of Samples | Nonconforming samples | amples dangeous to public health |
| | | number | % | number | % |
January | 382 | 53 | 13,8 | 2 | 0,5 |
February | 790 | 140 | 17,7 | 13 | 1,6 |
March | 970 | 166 | 17,1 | 3 | 0,3 |
April | 801 | 161 | 20,1 | 8 | 1,0 |
May | 697 | 159 | 22,8 | 11 | 1,6 |
June | 763 | 253 | 33,2 | 12 | 1,6 |
July | 784 | 198 | 25,3 | 14 | 1,8 |
August | 608 | 226 | 37,2 | 10 | 1,6 |
September | 661 | 219 | 33,1 | 20 | 3,0 |
October | 606 | 124 | 20,5 | 6 | 0,5 |
November | 541 | 94 | 17,4 | 4 | 0,7 |
December | 392 | 68 | 17,3 | 8 | 2,0 |
Total | 7995 | 1793 | 22,4 | 111 | 1,4 |
Graph 3.3.2: Food samples detected as nonconforming with microbiological requirements in 2002 (only laboratory analyses) 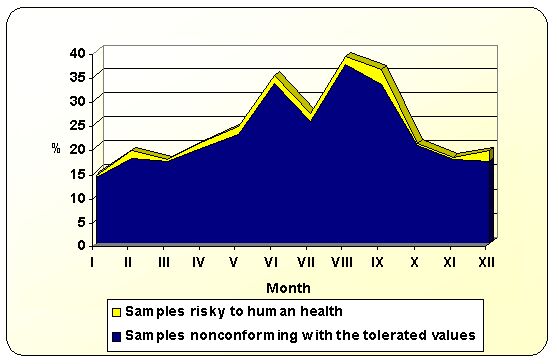
Graph 3.3.3: Microorganisms by types detected in the nonconforming food samples


 szpi.gov.cz
![Stránky archivovány Národní knihovnou ČR [otvíráno do nového okna]](../design/img/webarchive_certificate.png "Stránky archivovány Národní knihovnou ČR [otvíráno do nového okna]")